Join us for a free one-day workshop for educators at the Japanese American National Museum, hosted by the USC U.S.-China Institute and the National Consortium for Teaching about Asia. This workshop will include a guided tour of the beloved exhibition Common Ground: The Heart of Community, slated to close permanently in January 2025. Following the tour, learn strategies for engaging students in the primary source artifacts, images, and documents found in JANM’s vast collection and discover classroom-ready resources to support teaching and learning about the Japanese American experience.
Maps of American and Chinese international trade
A Talking Points resource: These World Trade Organization maps are based on 2009 statistics. The thickness of the lines indicates the relative size of the trade flow.
April 1, 2011
These maps and trends were raised in the March 31, 2011 issue of Talking Points, the USC US-China Institute's newsletter. Click here to subscribe to the newsletter. These maps are slightly edited and were originally generated at the WTO website.
Exports: 2009 US exports, US$1.06 trillion
Recipients: European Union, Canada, Mexico, China, Japan

Exports: 2009 Chinese exports, US$1.2 trillion
Recipients: European Union, US, Hong Kong (mostly reexported), Japan, South Korea

Imports: 2009 US imports, US$1.6 trillion
Suppliers: China, European Union, Canada, Mexico, Japan

Imports: 2009 Chinese imports, US$1 trillion
Suppliers: Japan, European Union, South Korea, Taiwan

Additional resources:
Other Talking Points trade information
US-China-Taiwan trade and investment (Talking Points, Feb. 24, 2010)
Graphs showing top trading nations (Talking Points, August 12, 2009)
US-China trade disputes (Talking Points, June 24, 2009)
Feb. 2011: The State of the Chinese Economy conference
Documentary segment: Tension over Trade (from Election '08 and the Challenge of China), YouTube version
Featured Articles
October 20, 2024
October 20, 2024
Please join us for the Grad Mixer! Hosted by USC Annenberg Office of International Affairs, Enjoy food, drink and conversation with fellow students across USC Annenberg. Graduate students from any field are welcome to join, so it is a great opportunity to meet fellow students with IR/foreign policy-related research topics and interests.
RSVP link: https://forms.gle/1zer188RE9dCS6Ho6
Events
Wednesday, November 20, 2024 - 3:00pm
Hosted by USC Annenberg Office of International Affairs, enjoy food, drink and conversation with fellow international students.
Thursday, November 7, 2024 - 4:00pm
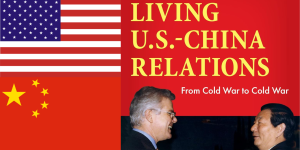
Join us for an in-person conversation on Thursday, November 7th at 4pm with author David M. Lampton as he discusses his new book, Living U.S.-China Relations: From Cold War to Cold War. The book examines the history of U.S.-China relations across eight U.S. presidential administrations.