Join us for a free one-day workshop for educators at the Japanese American National Museum, hosted by the USC U.S.-China Institute and the National Consortium for Teaching about Asia. This workshop will include a guided tour of the beloved exhibition Common Ground: The Heart of Community, slated to close permanently in January 2025. Following the tour, learn strategies for engaging students in the primary source artifacts, images, and documents found in JANM’s vast collection and discover classroom-ready resources to support teaching and learning about the Japanese American experience.
Visualizing the Geography of Diseases in china, 1870s-1920s: An Overview of the Earliest Disease Maps of China
The discussion explores the first disease maps of China that also present a visual history of the major transformations in modern medicine at the time
When:
April 26, 2013 4:00pm to 6:00pm
Where
Marta Hanson, Johns Hopkins University, Department of the History of Medicine
Center for Chinese Studies (CCS)
Why write about maps of disease? Medical mapping is a way of thinking; they are also statements in an argument and evidence furthering a specific case. The function of medical maps is to visualize causal relationships. On the one hand, disease incidence, and on the other hand, potential causes—the climate or weather, water and air quality, geological features, or an unknown poison in the environment. Maps of disease are never merely descriptive but useful ways for researchers to think through the relationship between the nature of any given disease and the specific environment that produced it. They also legitimated new public health interventions. I interpret over 50 medical maps of disease in China from the 1870s to the 1920s as both analytical tools intended to visualize the relationship between space and disease and rhetorical strategies to further new colonial power relations. These disease maps also present a visual history of the major transformations in modern medicine within China from the mid nineteenth-century peak of medical geography to the eventual victory of laboratory medicine by the early twentieth century. Maps, like nineteenth-century vital statistics and Petri-dishes not only made causal relations newly visible, they also made new methods for controlling animal and human populations newly possible.
Featured Articles
October 20, 2024
October 20, 2024
Please join us for the Grad Mixer! Hosted by USC Annenberg Office of International Affairs, Enjoy food, drink and conversation with fellow students across USC Annenberg. Graduate students from any field are welcome to join, so it is a great opportunity to meet fellow students with IR/foreign policy-related research topics and interests.
RSVP link: https://forms.gle/1zer188RE9dCS6Ho6
Events
Wednesday, November 20, 2024 - 3:00pm
Hosted by USC Annenberg Office of International Affairs, enjoy food, drink and conversation with fellow international students.
Thursday, November 7, 2024 - 4:00pm
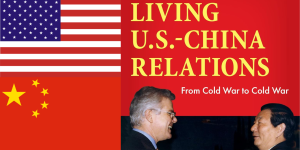
Join us for an in-person conversation on Thursday, November 7th at 4pm with author David M. Lampton as he discusses his new book, Living U.S.-China Relations: From Cold War to Cold War. The book examines the history of U.S.-China relations across eight U.S. presidential administrations.