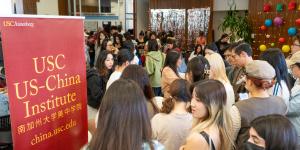
Join us for a free one-day workshop for educators at the Japanese American National Museum, hosted by the USC U.S.-China Institute and the National Consortium for Teaching about Asia. This workshop will include a guided tour of the beloved exhibition Common Ground: The Heart of Community, slated to close permanently in January 2025. Following the tour, learn strategies for engaging students in the primary source artifacts, images, and documents found in JANM’s vast collection and discover classroom-ready resources to support teaching and learning about the Japanese American experience.
America’s Soft Power is Still Supreme in Asia

In a short period of time, China appears to have created a systematic, coherent soft power strategy, and a set of soft power tools to implement that strategy. Through those tools – particularly its public diplomacy and its growing aid and trade – it has developed significant influence, though it is still in a honeymoon period in which many nations have not recognized the downsides of Beijing’s new power.
The survey aimed to compare the soft power of the United States, China, Japan, and South Korea in five areas: political, cultural, diplomatic, economic, and human capital. Polling firms were hired to collect the opinions of roughly 1,000 people in each of the following countries: the United States, China, Japan, South Korea, Vietnam, and Indonesia. Based on responses to 40 to 60 questions (asking about humanitarian assistance or building trust and cooperation in Asia, for example), the researchers calculated soft power indices which show the average level of influence on a 0 to 1 scale. Higher scores indicate greater influence.
Chinese, Japanese, and South Korean respondents judged the United States as having the greatest influence. Vietnamese ranked Japan as having greater influence than the U.S. while Indonesians judged the U.S. and Japan to be equal in their soft power. Americans ranked Japan and South Korea’s influence as greater than China’s. For all six populations surveyed, China ranked third in soft power.
|
Soft Power Index
Higher scores reflect greater influence. |
||||
|
Country
surveyed |
China
soft power |
Japan
soft power |
South Korea
soft power |
U.S.
soft power |
|
China
|
---
|
3 (.62)
|
2 (.65)
|
1 (.71)
|
|
Indonesia
|
3 (.70)
|
1 (.72)
|
4 (.63)
|
2 (.72)
|
|
Japan
|
3 (.51)
|
---
|
2 (.56)
|
1 (.69)
|
|
South Korea
|
3 (.55)
|
2 (.65)
|
---
|
1 (.72)
|
|
United States
|
3 (.47)
|
1 (.67)
|
2 (.49)
|
---
|
|
Vietnam
|
3 (.74)
|
1 (.79)
|
4 (.73)
|
2 (.76)
|
|
China’s Soft Power
Higher scores reflect greater influence. |
|||||
|
Country
surveyed |
Economic
|
Human Capital
|
Cultural
|
Diplomatic
|
Political
|
|
Indonesia
|
.73
|
.74
|
.62
|
.69
|
.71
|
|
Japan
|
.57
|
.58
|
.57
|
.44
|
.41
|
|
South Korea
|
.57
|
.64
|
.54
|
.51
|
.48
|
|
United States
|
.52
|
.55
|
.56
|
.40
|
.34
|
|
Vietnam
|
.70
|
.80
|
.77
|
.67
|
---
|
|
America’s Soft Power
Higher scores reflect greater influence. |
|||||
|
Country
surveyed |
Economic
|
Human Capital
|
Cultural
|
Diplomatic
|
Political
|
|
China
|
.73
|
.87
|
.66
|
.60
|
.68
|
|
Indonesia
|
.73
|
.91
|
.53
|
.69
|
.73
|
|
Japan
|
.70
|
.83
|
.69
|
.56
|
.66
|
|
South Korea
|
.75
|
.87
|
.66
|
.59
|
.75
|
|
Vietnam
|
.80
|
.89
|
.67
|
.68
|
---
|
|
Are you interested in following news about the [other country]?
|
||||||
|
|
very
|
somewhat
|
hardly
|
don’t follow news
|
not sure/
decline to state |
|
|
United States
|
38%
|
46%
|
10%
|
6%
|
0
|
|
|
China
|
24%
|
48%
|
10%
|
18%
|
1%
|
|
|
Has the U.S. effort to promote democracy and human rights had a positive or negative effect in Asia?
|
||||||
|
|
very
positive |
somewhat positive
|
somewhat negative
|
very
negative |
neither pos. or neg.
|
not sure / decline to state
|
|
United States
|
4%
|
64%
|
26%
|
5%
|
|
1%
|
|
China
|
15%
|
35%
|
22%
|
18%
|
4%
|
6%
|
|
Do companies from [the other country] have a positive impact in your country?
|
||||||
|
|
very
positive |
somewhat positive
|
somewhat negative
|
very
negative |
neither pos. or neg.
|
not sure / decline to state
|
|
United States
|
5%
|
36%
|
36%
|
18%
|
na
|
5%
|
|
China
|
18%
|
55%
|
16%
|
4%
|
na
|
8%
|
|
How important is it for your children to learn the language of [the other country]?
|
||||||
|
|
very
|
somewhat
|
slightly
|
not at all important
|
not sure/
decline to state |
|
|
United States
|
11%
|
23%
|
29%
|
34%
|
3%
|
|
|
China
|
82%
|
14%
|
3%
|
< 1%
|
< 1%
|
|
|
How often do you watch movies and television or listen to music from [the other country]?
|
||||||
|
|
daily
|
> 1 time
/ week |
> 1 time
/ month |
rarely
|
never
|
not sure/
decline to state |
|
United States
|
9%
|
27%
|
25%
|
23%
|
14%
|
1%
|
|
China
|
question not asked
|
|||||
The survey report includes details about how it was conducted and the questions that were asked. Interviews in Indonesia and Vietnam were conducted face to face. Those in China, Japan, and South Korea were conducted by phone. In the U.S., the initial contact was made by phone and then internet access was provided to complete the survey. An effort was made to adequately balance urban and rural responses and to draw respondents from all over the countries. Depending on the population surveyed, the researchers put the margin of error at 3.0-3.5%.
The complete report is available from the Chicago Council on Global Affairs. Click here to download the topline survey results.
Previous USCI reports on opinion surveys:
Featured Articles
Please join us for the Grad Mixer! Hosted by USC Annenberg Office of International Affairs, Enjoy food, drink and conversation with fellow students across USC Annenberg. Graduate students from any field are welcome to join, so it is a great opportunity to meet fellow students with IR/foreign policy-related research topics and interests.
RSVP link: https://forms.gle/1zer188RE9dCS6Ho6
Events
Hosted by USC Annenberg Office of International Affairs, enjoy food, drink and conversation with fellow international students.
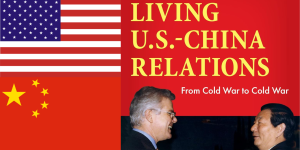
Join us for an in-person conversation on Thursday, November 7th at 4pm with author David M. Lampton as he discusses his new book, Living U.S.-China Relations: From Cold War to Cold War. The book examines the history of U.S.-China relations across eight U.S. presidential administrations.


